Tables and figures play a crucial role in communicating research findings clearly and effectively. For agriculture, veterinary, and life science students, mastering the correct use of tables and figures is essential for writing theses, journal articles, and technical reports that meet international academic standards.
Research data often involves large datasets that cannot be explained meaningfully in just one or two sentences. In such cases, tables and figures help summarize complex information in a visually appealing and reader-friendly manner. However, visual elements should support the text, not repeat it.
Importance of Tables and Figures in research Writing
Well-designed tables and figures enhance clarity, improve readability, and strengthen the scientific impact of your research paper. They help readers quickly identify patterns, trends, and comparisons that may otherwise remain unclear in textual explanations.
In both APA and MLA research papers, tables and figures are mandatory components, although formatting rules may differ. A simple rule to remember is that if your data cannot be explained clearly in one or two sentences, it should be presented as a table or a figure.
Structure and Components of a Table in a research paper
Tables must be organized logically so that readers can understand the data at a glance. Poorly structured tables often confuse readers and reduce the credibility of your research.
Table Title
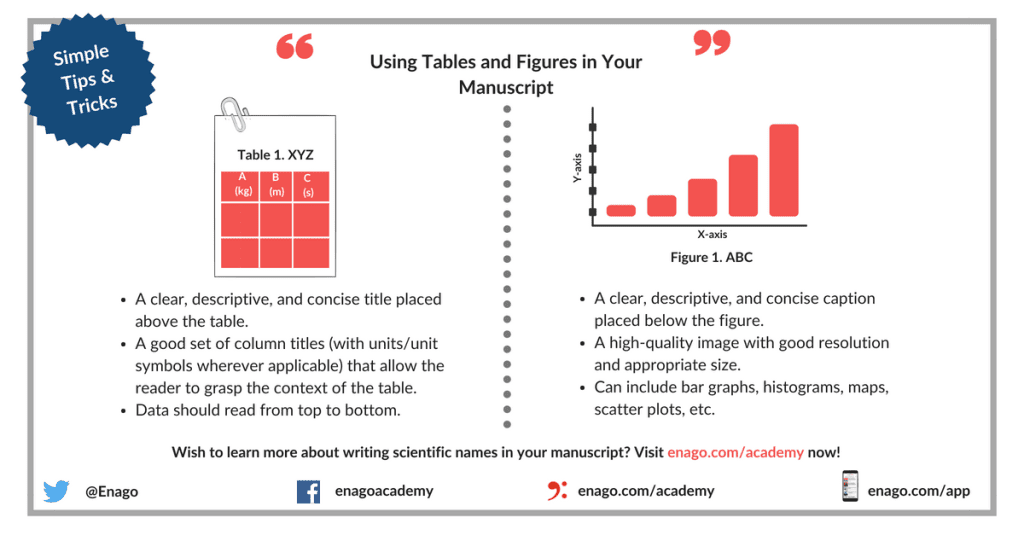
Each table should have a clear and descriptive title that functions as the topic sentence of the table. Depending on the discipline, the title may be brief or detailed, but it must clearly explain what the table presents.
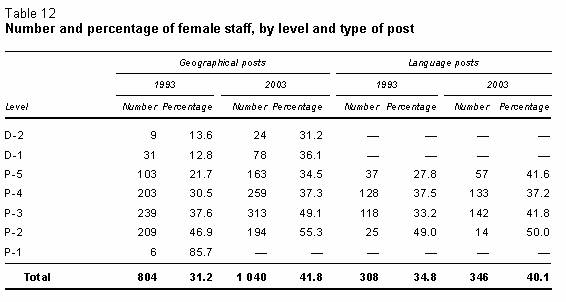
Column Headings
Column titles guide the reader from the table title to the data itself. Well-designed headings allow readers to interpret the table quickly without referring back to the text.
Table Body
The body of the table contains numerical or textual data. Data should be arranged vertically rather than horizontally to improve readability. Tables should be centered on the page, separated from surrounding text, and numbered sequentially based on their first appearance in the text.
Proper Placement of Tables and Figures in a research paper
Tables and figures should be placed close to where they are first mentioned in the text, preferably immediately after the paragraph that introduces them. Text wrapping around tables and figures should be avoided, as it reduces clarity.
Some journals require tables and figures to be placed after the references section, so always follow the target journal’s author guidelines.
Understanding Figures in Research Papers
Figures include graphs, charts, photographs, maps, diagrams, and illustrations. The choice of figure should always prioritize reader comprehension. For example, spatial relationships are best shown through photographs or diagrams, while trends over time are better illustrated using line graphs.
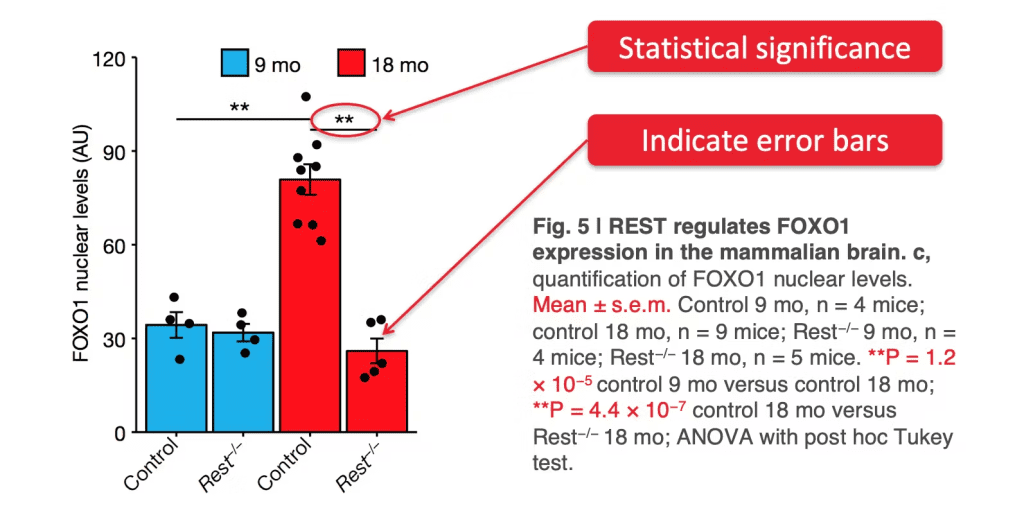
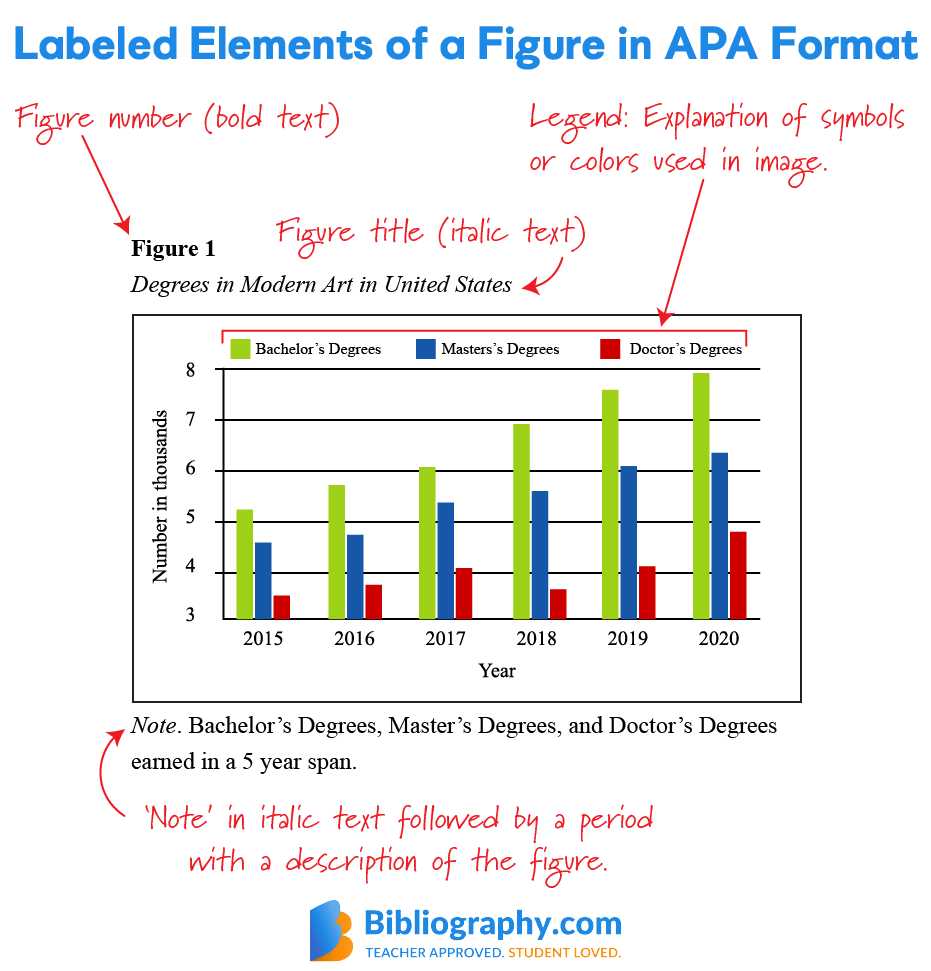
Figure Captions
Figures must be numbered and accompanied by concise, descriptive captions placed below the figure. Captions should allow readers to understand the figure without referring back to the text.
Image Quality and Design
Figures should be simple, clear, and visually balanced. Pay attention to image resolution, size, and overall readability. Blurry or overcrowded figures reduce the scientific value of your paper.
Additional Information and Legends
Any symbols, colors, or abbreviations used in figures must be explained through legends. Figures are numbered separately from tables to avoid confusion.
Key Principles for Creating Effective Figures
Figures should always complement written content, not replace it. While visuals help simplify complex explanations, they must be based on data discussed in the text.
Poorly designed visuals or unnecessary decorative graphics can mislead readers and weaken your argument. Always choose visuals that clarify trends, illustrate processes, or support comparisons relevant to your research objectives.
Five Rules for Integrating Visual Elements in a research paper
Each table or figure must have a numbered caption with a descriptive title and must be referred to by number within the body text. All units, axes, legends, and labels should be clearly identified.
If the visual was not created by you, its source must be acknowledged. Most importantly, visuals must represent data accurately and ethically without distortion or bias.
Labeling Tables and Figures Correctly in a research paper
Table captions are placed above the table, while figure captions appear below the figure. This placement follows natural reading patterns and helps readers quickly identify what the visual represents.
When figures or tables are sourced from other publications, the original reference must be included in the caption to maintain academic integrity.
Referring to Tables and Figures in Text
Always refer to tables and figures by their numbers rather than their position on the page. Statements such as “see Figure 2” or “results are summarized in Table 1” maintain clarity and professionalism.
Highlighting figure or table numbers in bold within the text can further improve readability, especially in long research papers.
Conclusion
The effective use of tables and figures is a fundamental skill in academic and scientific writing. For agriculture and veterinary research students, properly designed visuals enhance clarity, improve data interpretation, and strengthen the overall quality of research papers.
By following standardized guidelines and prioritizing reader understanding, tables and figures become powerful tools that support scientific communication rather than distract from it.
Want to improve your academic writing and referencing skills?
Explore Pedigogy’s Research and Publication Hub for expert-led lessons, citation tools, and writing guides tailored for B.Sc. Agriculture and B.V.Sc. & A.H. students. For more citation and research-writing guides, visit Pedigogy.com’s Research Hub — your trusted platform for research-based academic learning.
Updated on December 23, 2025