Relationship between Total, Average and Marginal products

a) Total product (TP) and Marginal product (MP)
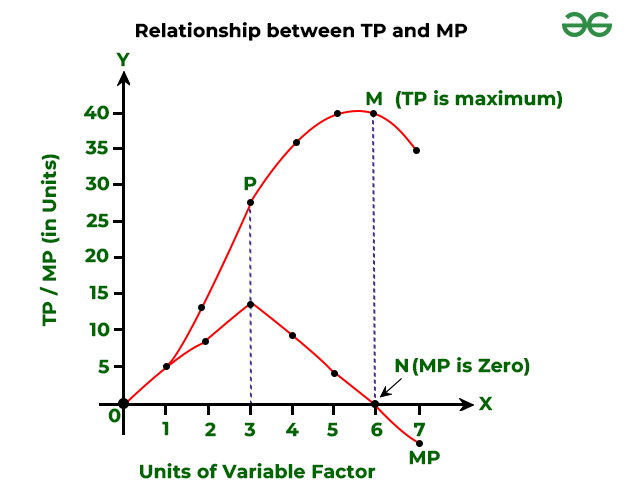
(1) Since the marginal product (MP) is a measure of rate of change, therefore;
i) When total product (TP) is increasing, the marginal product is positive.
ii) When Total product (TP) is constant, the marginal product will be zero.
iii) If the total product decreases, the marginal product will be negative.
2) So long as MP moves upward or increases, the TP increases at an increasing rate.
3) When the MP remains constant, the total product increases at a constant rate.
4) When the MP starts declining or slopes downward, the total product will be increasing at a decreasing rate.
5) When MP equals zero or MP curve intersects X – axis, the TP will be at maximum.
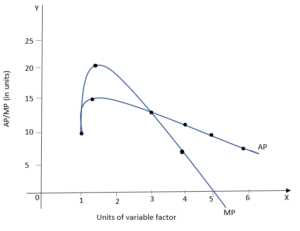
b) Marginal Product (MP) and Average Product (AP)
1) When the average product is increasing, the marginal product must be greater than the average product. When MP> AP, AP is increasing.
2) When AP is decreasing, the MP is always less than the AP. When MP<AP, AP is decreasing.
3) When AP is equal to MP, at this point AP will be at the maximum. When MP=AP, AP is at a maximum.